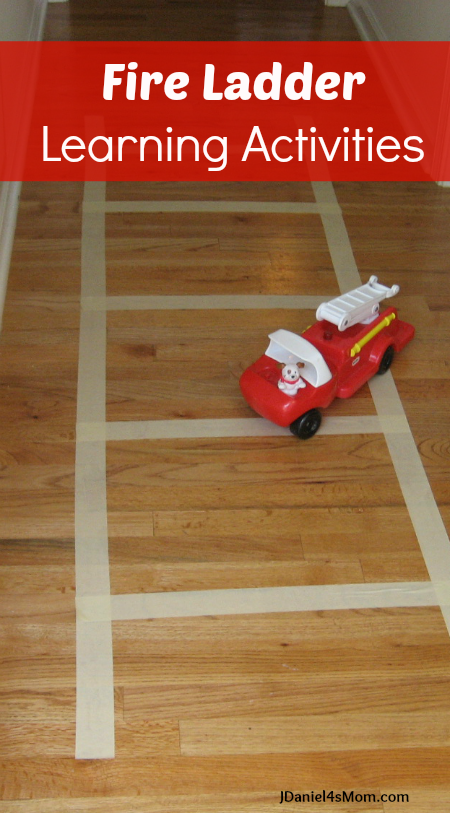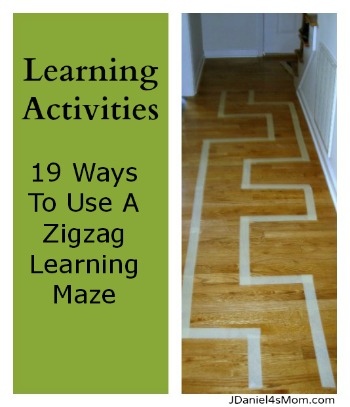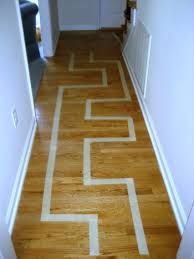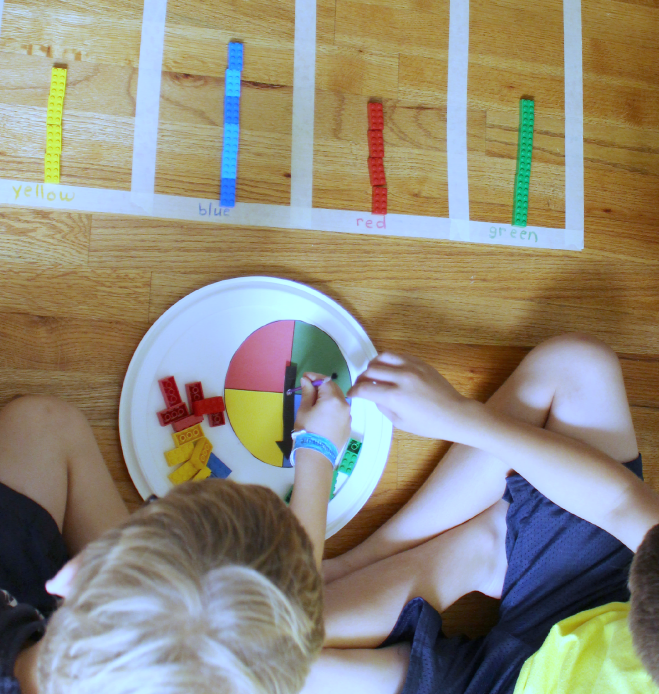
A roll of masking tape can become a pretend ladder to climb, a maze to explore or a graph to display data on when it is simply rolled out onto the floor. Recently we created a graph on the floor in our main hallway. The graph would display the number of times each color on a spinner would be selected.
It was really easy to create a graph. First a simple rectangular box was created with tape. Then columns were created in the box by placing three long stripes of tape inside the box. We tried to make each of the columns equal in width. (I think it is okay that they are not just perfect.) At the base of each column in the graph a color word was placed. I wrote each color word in that color with a marker. We would be working with red, blue, green, and yellow so those were the words that were written in the column.
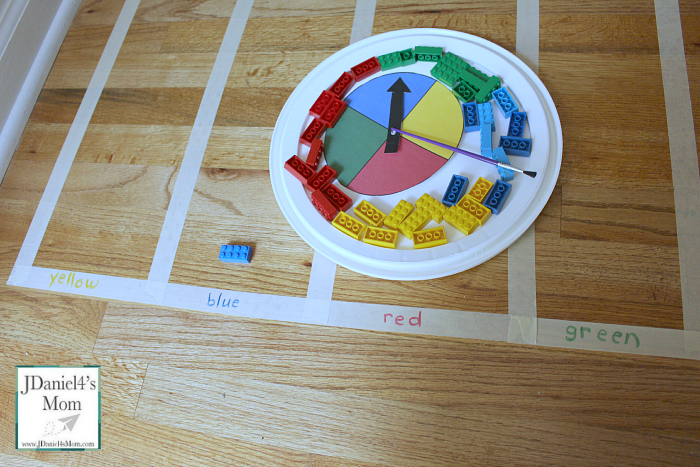
Prior to making the graph I created a spinner displaying the four colors in Paint along with a black spinner. Both the spinner and the arrow were printed out on card stock. After cutting out the arrow, a hole was created using a hole punch in the area represented by a white circle on the arrow. Then the arrow was taped to paperclip. (The paperclip would help it spin more easily.)
I then gathered the remaining activities supplies. We needed the following:
- red, green, blue, and yellow LEGO bricks
- narrow paintbrush to hold the spinner in place
- a large plastic lid to hold all the activity supplies
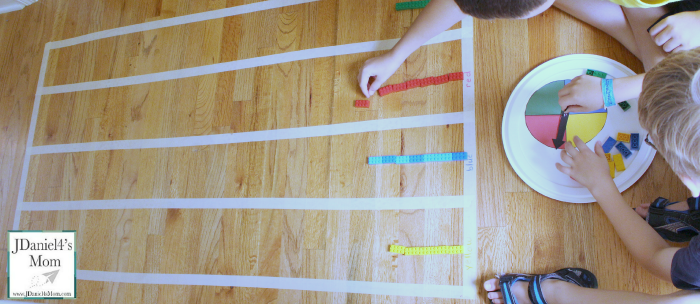
How to Gather Data to Graph
We decided to see what color we would spin the most during ten spins. Each child took turns spinning the spinner. The spinner was spun by holding a paintbrush in the hole in the arrow with one hand and spinning the spinner with the other. After that they selected a brick that was that color and placed it in the color column that was designated for that color. After ten spins it looked like the color red was spun the most.
JDaniel and his friend decided to spin the spinner ten more times to see if red would remain the most spun color. Before they start the second set of spin, we rotate the spinner so the red area was on the other side of the spinner. Guess what? We didn’t have red as the winner this time. Blue gained the most spins.
We decided that the slant of the lid we were spinning on might have effected the spins. I guess we should have really placed the spinner on the floor. I was trying to keep all the activity materials all together by placing them on the lid.
This is part math series hosted by Peakle Pie. Please take a moment to check out the math activities shared on her Cool Maths for Cool Kids page.
Let me know how this activity works out for your children. I would love to know if red or blue gets the most spins at your house. Let me know by leaving a comment below.


