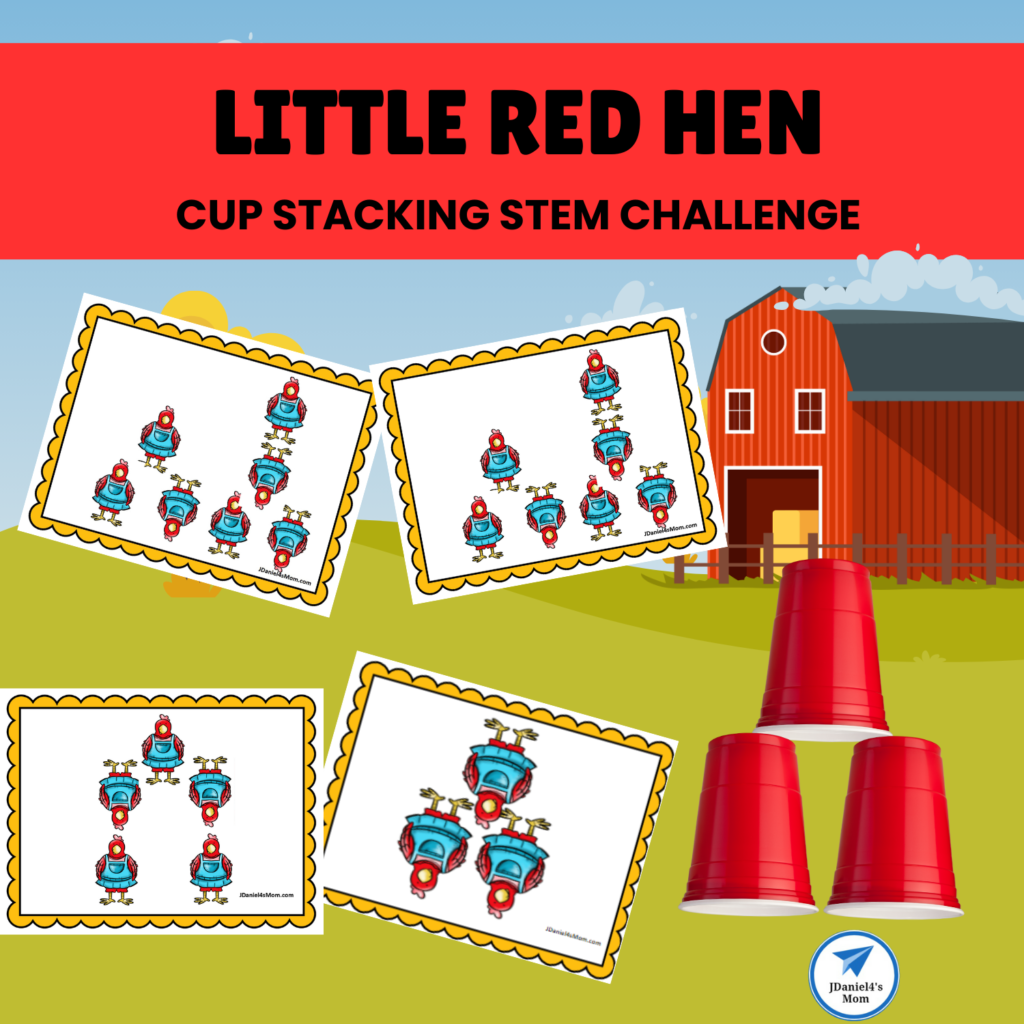
The Little Red Hen Cup Stacking set features 32 cup stacking challenges. The cards feature right-side-up little red hens for cups that need to be faced up. Red hens upside down represent cups that are upside down.
The set features simple cup stacking challenges that use no more than nine cups. The Little Red Hen Cup Stacking set would be great to explore with young children or children who need simpler tasks. Once each stack is complete, children could be asked to add a few more cups to make the stack more complicated.
Getting the Little Red Hen Stacking Cards
First, you will need to download the set.
Second, if you don’t have Acrobat Reader you will need to download it. The set is an Acrobat Reader PDF file.
Third, you will need to go to your download file and open the page. You may be asked if you want the file to open after downloading it. If you are, you won’t have to hunt for it in your download file.
Finally, when you open the cards and decide which ones you want to print.
Getting the Cards Ready to Use
If you plan on using the cards over and over again, you may want to laminate them. Below I have suggested products that you may want to use to cover them.
The links below are affiliate links. As an Amazon Associate, I earn from qualifying purchases. My Amazon Picks

Scotch Brand PRO Thermal Laminator, Never Jam…$54.68$128.93 (11154)

Thermal Laminating Pouches, 100 Count-P…$15.98$24.68 (63556)

Scotch Thermal Laminating Pouches, 200- Count-…$27.99$42.99 (23612)

Hammermill Printer Paper, Great White 100% Recy…$17.00 (4917)
Exploring the Little Red Hen Stacking Cards
Understanding What the Pictures Are Showing
While most children will look at the upside-down character or object and know it means the cup is upside down, others may be confused. You may need to have your children explain what the pictures are telling them to do with the cups on a card or two. Once they understand what the pictures are telling them to do, they will be able to complete cards on their own.
If they end up building structures that are the opposite of the card, you can decide if you want to correct them. It may be important to you that you build it just like the card. It may be important that they just practice cup stacking.
How to Explore the Cards
Here are a few ways to explore the challenge:
- First, you can have children try trying building a stack with your help.
- Second, children can all build a stack displayed on a card.
- Third, children can each try to build a stack displayed on their card.
- Finally, children can work in a center with challenged cards and cups.
More STEM or STEAM Challenges
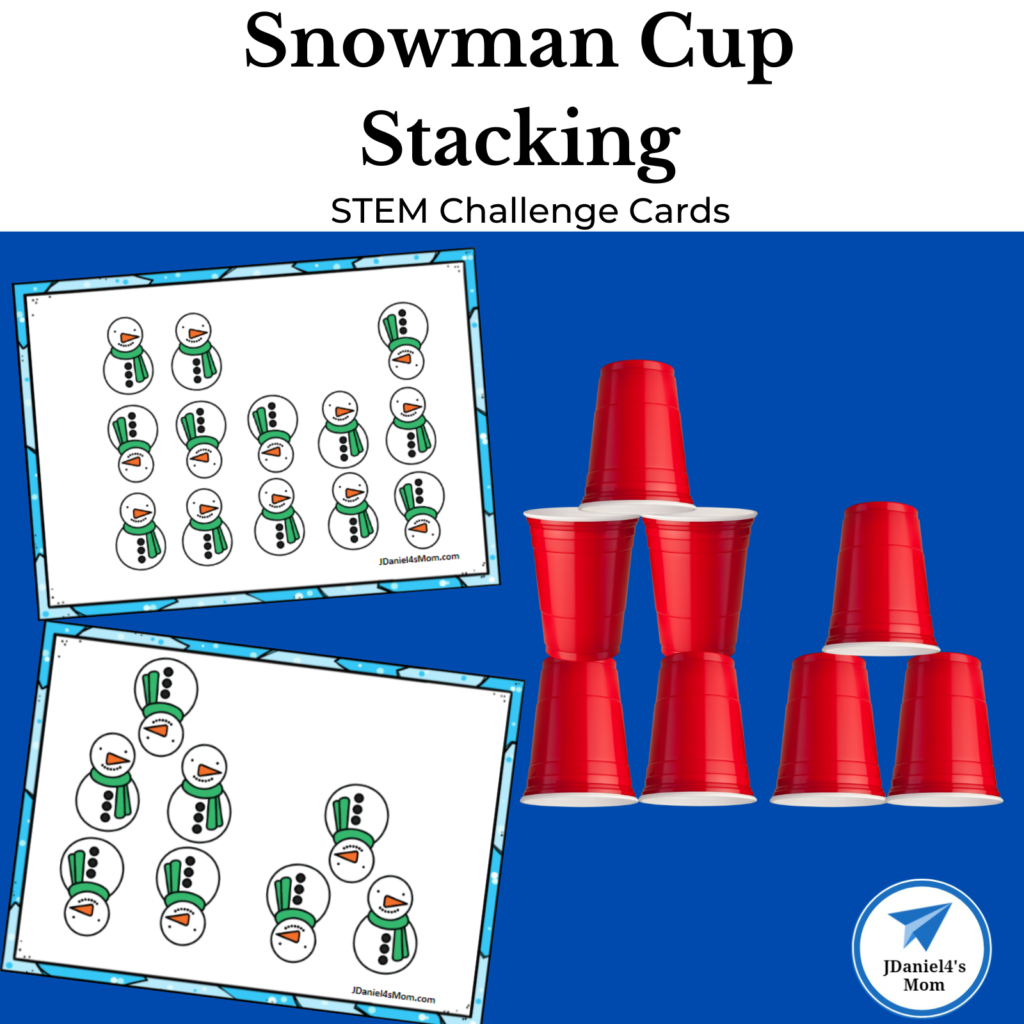
Snowman Cup Stacking Challenges


